Technical Guide
When fasteners or any headable parts are upset, extruded or otherwise cold formed from stainless steels or high temperature alloys, results of the process ultimately depend on the proper use of lubrication to reduce friction.
The two components in lubrication, of course, are coatings and lubricants. Coatings, the principal topic of this discussion, are substances applied to the wire by electroplating, dipping or drawing at the mill. Lubricants generally are materials applied by the fabricator during cold forming.
Whether it’s the low-level upsetting of an easily cold formed stainless steel, or the heavy extrusion (greater than 20% reduction of area) of a high temperature alloy, good lubrication practice is essential to help prevent fabrication difficulties like galling, die seizing or tooling failure.
Until recently, selecting the best coating for a cold forming application was not as easy as many would like because no objective tests had been available to help manufacturers evaluate coating effectiveness in the various forming operations performed today. In the absence of satisfactory experience, choices have been made more on the basis of estimates than on reliable data.
That drawback has been removed with completion of an intensive two-year research study by the Lehigh University Institute for Metal Forming, Bethlehem, PA, funded by Carpenter Technology Corporation, the Ben Franklin Technology Partners of Northeast Pennsylvania and Lehigh University. Major participants were Lehigh’s Dr. Wojciech Z. Misiolek and Mario E. Epler.*
Lehigh Test
During that two-year period, the engineering school developed a special test to evaluate the relative performance of "Coated Wire Feedstock for Cold Heading Products." The test simulates the actual plant-floor fastener manufacturing process. It is predicated on the essential role of coatings in manufacturing – to lower the heading forces, promote material flow into complex shapes, reduce die wear and minimize temperature increase. The test also was designed to capture variation in material response to all process conditions based on differences in type of coating, its thickness, as well as yield strength of the feedstock examined.
Three commonly used substrate materials were coated in the testing program. (Fig. 1) Carpenter Technology 430 stainless was chosen because it is most easily formed of the three. Carpenter Technology Custom Flo 302HQ stainless was selected for its medium-range formability, and Carpenter Technology A-286 alloy because it is the most difficult to cold form and is the high temperature alloy most frequently cold headed.
Various coatings and combinations of coatings in common industry use were applied to wire of the above alloys, then evaluated and ranked in the Lehigh tests according to their relative efficiency. Included were copper, soap, Carpenter Technology Ecolube® II (molybdenum disulfide – MoS2), oxalate and Carpenter’s Carpenter Technology KnightCote™ coating . In addition to single coatings, duplex coatings for the most severe cold forming applications were tested.
For purposes of comparison, coatings in different thicknesses from 50 microinches to 200 microinches were tested for effectiveness. Some bare wire was also tested to measure the force required to extrude different uncoated substrates, relative to the energy required for the single coatings and coating combinations measured in the tests.
Two-Part Test
Lehigh developed a two-part test to investigate the effectiveness of various coatings and coating combinations on the three types of substrate wire in the study. A wire drawing test and a trapped wire extrusion test were both used to generate data about coating performance in terms of coefficient of friction (drawing test), and maximum extrusion load and coating failure potential (extrusion test).
Standard laboratory testing machines were used to gather deformation force data, which was then interpreted through several mechanical relationships to coating performance and material workability. The newly developed Lehigh test, an extension of existing testing capabilities at Carpenter, can serve as a universal test done by the wire producer or the fastener manufacturer.
For the drawing test, coefficient of friction for the coating/substrate combination was calculated. For the headability/extrusion test, coating performance was evaluated through maximum extrusion force, energy necessary to extrude a part of given geometry, the shape of the curve associated with the load/stroke data for the extrusion, and the amount of standard deviation for the maximum load.
The extrusion curve generated in the extrusion test revealed data quite useful in evaluating coating performance. The patterns observed could be attributed to (a) typical extrusion, (b) extrusion where the part sticks in the die due to packing of the deformation zone with coating/lubricant, and (c) non-uniform friction during deformation.
Researchers found that the coatings exhibiting the highest coefficient of friction in the drawing test also exhibited die packing in the extrusion test. This test confirmed the expectation, maximum extrusion force was inversely proportional to headability.
The team arrived at two conclusions based on those findings – 1) A comparison of maximum extrusion force between different coatings can be made if there is a friction-related problem in the operation such as excessive die wear or surface finish defects and 2) If a given heading geometry results in broken punches or die packing, a coating should be substituted that exhibits lower failure potential and a more favorable extrusion curve.
Wire Drawing Test
Use of a drawing test allows a first approximation of the frictional characteristics of the coatings to be considered. The same test also provides insight to coating adherence, although it alone is not enough to easily evaluate the ability of a coating to last through multiple forming steps. Generally, the coefficient of friction calculated from the drawing test provides a standard measure of effectiveness that is often used.
Friction in the wire drawing process affects total amount of deformation achievable, deformation forces, surface finish and distribution of strain, therefore mechanical properties of the deformed wire. While friction occurs in the approach portion of the die (Fig. 2), its effect is seen much more in the bearing portion of the die. The shape of the bell and the approach angle are designed to promote the flow of lubricant into the die and increase the hydrostatic pressure of the lubricant. The surface of the wire is refined in the bearing portion of the die, as well as damage removed that may have been caused by die wear.
Fig. 2 Wire Drawing Die
Formability, material function and process function are all investigated in the Lehigh wire drawing test. Formability is considered the amount of deformation a material can withstand without undergoing surface deterioration such as cracking, tearing or internal microvoids. Material function includes material properties such as flow stress, strength, strain-rate dependence on ductility, and stress and microstructure dependence on temperature. For wire drawing, the major process variables are amount of strain (cross-section reduction), die design, lubrication and drawing speed.
One of the most common parameters to change to influence deformation characteristics is the coating or lubricant used in the process. Following are the minimum criteria to apply in selecting the most suitable lubricant – (a) it should not react excessively with the work material or the die material; (b) it should sufficiently wet the surface and adhere enough to properly lubricate the workpiece; (c) it should produce a significant reduction in sliding friction, deformation forces and deformation temperature.
The evaluation of coatings/lubricants in the wire drawing test was based upon the value of μ Dies with varying bearing lengths but similar reductions and die angles were used to measure force. By using a mechanical force balance, a value for μ could be calculated for each die and each coating/lubrication combination.
Drawing stress was determined by dividing the drawing force by the wire cross-sectional area after drawing. Drawing force measurements were considered accurate to five significant figures (a tenth of a pound for the 5,000-pound load cell, and a hundredth of a pound for the 500-pound load cell). Coefficient of friction μ was carried out to four significant figures so coatings could be compared that exhibited similar coefficient of friction values. The coefficient of friction for each coating/substrate combination then could be compared for any given die geometry.
The wire drawing test produced a useful measurement of the force required to deform a test blank. It did not evaluate any effect of coating on die wear or temperature for sustained periods of drawing at high speeds. Coating differences were accounted for through differences in flow stress of the coated material and die geometry.
Wire Drawing Procedure
Wire lengths of commercial quality Carpenter Technology 430 (S43000) stainless, Carpenter Technology Custom Flo 302HQ (S30430) stainless and Carpenter Technology A-286 alloy (K66286) were drawn through various dies, with the same reduction and die angle, on a Waterbury-Farrel hydraulic drawing bench. Five samples of each coating were drawn through dies for each of the grades tested. Each wire section tested was about 3 ft. (0.9144 m) long.
All of the single and duplex coatings tested are designated in Fig.3, including a bare wire sample of each alloy. Four different die-bearing lengths were used in the tests. Draw speed employed was approximately 6.5 ft/min (1.98 m/min.) Initial wire diameter was 0.1343 in. (3.411 mm) or 0.131 in. (3.327 mm). Drawing caused a reduction of approximately 10.5%. Commercial Hammidraw 1846-B drawing grease in a drawing box ahead of the die was used to lubricate the wire.
Drawing force was measured using either a 5,000- or 500-lb. (22,241 or 2,244.1 N) capacity Entran load cell. The load cell used depended on bearing length and substrate material flow stress. Output signal from the load cell was amplified and read by a National Instruments data acquisition card implemented with the company’s LabView software. Drawing force in pounds was determined from recorded voltages by using a computer-generated spreadsheet and arithmetical computations.
Extrusion Test
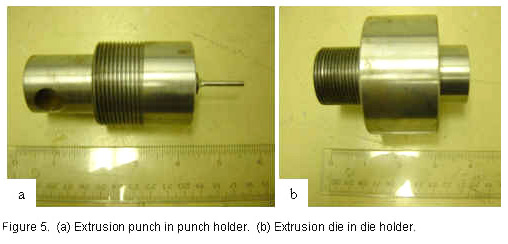
The second test to characterize coating performance is based on use of actual cold heading production dies. Fig. 4 shows the cross-section of a trapped-forward extrusion die utilized for testing. The undeformed test blank is placed in the container of the die and forced during extrusion through the deformation zone and bearing portion of the die where maximum frictional force occurs.
Trapped-forward extrusion dies were used in the tests instead of open-forward extrusion dies because the former permit much greater reductions (up to 75%). Although open-forward dies are more common, material extruded in open-forward dies tends to upset above the lower portion of the die, where the reduction is performed, if frictional and deformation forces in the deformation zone are too high. This tendency typically limits reduction to 30% or less.
Wire Extrusion Procedure
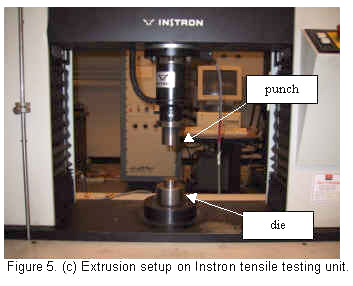
Sample lengths of commercial quality Carpenter Technology Custom Flow 302HQ stainless, Carpenter Technology 430 stainless and Carpenter Technology A-286 wire were cold extruded on an Instron tensile testing unit using a radial die and flat punch set (Fig. 5). All of the wire had been predrawn in the drawing test using a drawing grease or lubricant. Sections were drawn from 0.1343 to 0.1270 in. dia. (3.411 to 3.226 mm), then extruded to a final diameter of 0.101 in. (2.57 mm).
For test purposes, extrusion blanks were cut into three different lengths – 0.716, 0.587 and 0.446 in. (18.2, 14.9 and 11.3 mm). They were designated as long, medium and short length extrusions. The shortest extrusions, however, could not be used for testing because they were not long enough to reflect steady-state extrusion conditions. Each extrusion was run at crosshead speed of 20 inch/min. (0.5-8 m/min.).
During extrusion, load/stroke data was captured at a rate of 20,000 pts/scc. Data obtained was converted by computer into maximum extrusion load, extrusion shape and area under the curve. Residue of coatings was cleaned from the bore of the die to prevent any buildup. For each coating/substrate combination, five samples were extruded for each extrusion geometry. Similar extrusion tests were run on a production header in a manufacturing facility.
The extrusion test produced numerical measurements for maximum extrusion load and area under the extrusion curve. The shape of the extrusion curve, the amount of standard deviation for the maximum load and the area under the curve are used to evaluate the coatings’ performance.
The extrusion test, compared with the drawing test, gives much more relevant and useful data about each coating’s performance during deformation in cold heading. It very closely simulates the cold heading process, and thus is quite useful in evaluating materials.
Coating Rankings
The results for medium and long extrusions in Figs. 6, 7 and 8 can be used to determine relative coatings performance. The rankings reflect an increasing amount of maximum extrusion force (lbs.) required to cold head wire of the three test alloys in bare condition and with various single or combinations of coatings.
In general, duplex coatings performed better than any single coating in severe applications, as did Carpenter Technology KnightCote coating over copper. In some instances, Carpenter Technology KnightCote alone worked as well as a duplex coating or copper coating, with the environmental benefit of eliminating pollution and disposal problems.
Oxalate coatings did not perform as well as Ecolube (molybdenum disulfide) coatings, 100 microinch copper coatings and KnightCote coatings. With the exception of 430 stainless, Carpenter Technology Ecolube coatings were found to be less effective than Carpenter Technology KnightCote coatings.
Thickness of some coatings can have a distinct influence on coating effectiveness. For example, the extrusion test showed that a lower maximum extrusion force was required to cold form wire with a 100 microinch copper coating than the same diameter wire with both 50 and 200 microinch coatings. In this case, the 100 microinch copper coating is near the ideal coating thickness for this particular application. The 50 microinch thickness is not thick enough to provide optimal lubrication, and the 200 microinch thickness is too much. The additional copper in the thickest coating actually increases the force required to head the same geometry.
Conclusions
Both friction conditions in deformation and coating response to process parameters are critical in testing. No one single test can duplicate the complex relationship between friction conditions in deformation and various coatings’ response to process parameters. However, relationships between the two have been determined and maximum extrusion force can be measured via carefully controlled and repeated tests to provide useful evaluation of coatings on substrates tested.
Both the wire drawing and the extrusion step must be considered in the evaluation. If a coating cannot pass the drawing step, assuring a good surface finish and a straight wire, it will not be effective in increasing headability.
If die wear is a problem, the maximum required extrusion forces for the different coatings should be compared. When punch breakage is a problem, the extrusion curve should be checked to be sure of using a coating that does not exhibit die packing.
Coating/lubricant performance must be evaluated for the specific substrate to be covered. Each tested lubricant or lubricant combination performs in different manner with each substrate material tested.
Future Work
Carpenter plans to refine the Lehigh testing procedure, and is already using it to generate test data on heading alloys now under development.
Lehigh researchers feel that the use of electron microscopy can help in the study of surface finish on samples used in wire drawing tests. They feel that appearance of the wire after drawing, along with drawing force data, can be used more specifically to determine the friction conditions for each coating.
___________
*Reference 1. Epler, M. E., Misiolek, W.Z., Development of an Evaluation Test of the Coated Wire Feedstock for Cold Heading Products, Ben Franklin Grant #2298, Final Report, February 11, 2003.
Reference 2. Epler, M.E., Misiolek, W.Z., An Experimental Evaluation Method for Wire Coatings, Sixth Easaform Conference on Forming, Salerno, Italy, April 28-30, 2003.
Reference 3. Misiolek, W.Z., Development of an Experimental Method for Performance Evaluation of Cold Heading Coatings and Lubricants Utilizing Cold Extrusion, Department of Mechanical Engineering, The University of Aukland, September 24, 2004, Auckland, New Zealand.
Reference 4. Heading Hints, Carpenter Technology Corporation
***
By Charles T. Polinko and Kevin P. Hughes
Carpenter Technology Corp.
Reading, PA, USA