Technical Guide
An overall Toughness Index can provide important insights during the materials selection process.
In today’s universe of specialty materials, designers must consider toughness along with strength and fatigue resistance when comparing alloys. Toughness can be measured in different ways, such as Charpy V-Notch Impact Energy, Plane Strain Fracture Toughness, Unnotched Izod Impact Energy, da/dn Crack Growth rate, Area Under the Stress-Strain Curve, and others. Unfortunately, these options can be time consuming and lead to mixed results.
In practice, for example, a single toughness property for an alloy is often considered after strength and fatigue resistance comparisons have narrowed the field. Other toughness measurements that could be important might be ignored or used only as tie-breakers.
Such drawbacks demonstrate the need for a single, overall toughness measurement that could function in combination with strength and fatigue resistance to aid in materials comparison and selection. An ideal toughness measurement would have to be easy to calculate and must fully represent the overall toughness of each alloy.
This article discusses a new overall “Toughness Index” that combines three measures of toughness into a single parameter that can graphically compare alloys.
Goodman Diagrams
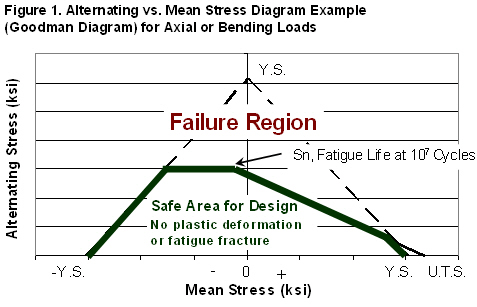
Although today computers can simplify the selection of alloys, graphical comparison methods are still useful. One of the more helpful graphical methods that evolved in the late 19th and early 20th centuries was the Goodman diagram, in which tensile and rotating bending fatigue data served to illustrate a safe design envelope, as shown in Fig. 1. Goodman diagrams for several different alloys could be drawn on top of each other; the alloy with the largest safe design envelope would be chosen for the application.
Note that the Goodman diagram does not include any measure of toughness. That’s because prior to World War II, toughness was a qualitative assessment. Ductility as measured by either the elongation or reduction of area in the tensile test, was used along with strength to give a qualitative measure of the toughness of the alloy. A material with high ductility and high strength was considered tougher than a lower-strength material with the same high ductility. However, as a result of research that started during World War II with the Charpy V-Notch Impact Test, the measurement of toughness became an important design parameter.
Toughness Measures
Toughness is characterized generally as the amount of damage a material can withstand before fracture, and this is defined as the area under the stress-strain curve of a tensile test. A simple approximation to the area under the stress-strain curve is given by:
Area Under the Stress-Strain Curve = % Elongation x ((YS + UTS)/2)
In effect, this measure indicates the toughness of an alloy with no flaws, under static loading conditions.
However, in the real world toughness is measured in different ways depending on loading conditions (static, dynamic or impact), and the kind of damage the part needs to withstand (flaws or notches). When dynamic conditions and the effects of flaws or cracks must be considered, Charpy V-Notch Impact Energy (showing effects of notches and impact loading) and Fracture Toughness (indicating the critical crack size that alloys can tolerate) are often considered.
Toughness Index
Now, we have developed a new Toughness Index that effectively combines the three generally accepted measures of toughness:
- The area under the stress-strain curve
- Charpy V-notch toughness
- Fracture toughness, KIc
This single index is effective because it measures the overall toughness of an alloy under a variety of loading conditions, with and without flaws.
The Toughness Index incorporates different measures of toughness. It is useful because (a) it does not overly weigh one toughness measure over another, and (b) it is relatively easy to calculate from readily available data.
Furthermore, it satisfies the first criterion of balance by essentially “normalizing” all toughness measures included in the toughness index to approximately the same value. In this way, it avoids overly weighting one toughness measure over another.
The Normalizing Procedure
The normalizing procedure emerged from an analysis of the mechanical properties of AerMet® 100. This alloy is considered to be a benchmark alloy because it has a superior combination of strength and fracture toughness for a structural steel. As shown in Table 1, AerMet® 100 alloy has been averaging 246 ksi yield strength, 287 ksi ultimate tensile strength, and 16.1% elongation with a fracture toughness of 120 ksi√in. CVN impact energy at this strength is also outstanding at 35 ft-lb.
Table 1. Mechanical properties of the AerMet® family compared with maraging, titanium, and 4340 alloys
|
|
AerMet® Family |
NiMark Alloys/Marage Family |
|||||
|
Property |
900°F Aged |
875°F Aged |
Marage 350 |
||||
|
Y.S. (ksi) |
246.0 |
258.0 |
275.0 |
314.0 |
249.9 |
281.6 |
336.4 |
|
U.T.S. (ksi) |
287.0 |
302.0 |
315.0 |
352.0 |
258.6 |
291.0 |
343.6 |
|
Elong. (%) |
16.1 |
14.2 |
14.5 |
11.3 |
10.7 |
8.6 |
6.1 |
|
R.A. (%) |
67.3 |
63.8 |
63.0 |
55.2 |
51.1 |
40.8 |
22.2 |
|
KIc (ksi in. 1/2) |
120.0 |
98.7 |
65.0 |
31.5 |
91.5 |
67.7 |
38.5 |
|
CVN I.E. (ft-lb.) |
35.0 |
30.0 |
20.0 |
10.8 |
20.5 |
18.5 |
10.0 |
|
Modulus (psi x 106) |
28.2 |
27.9 |
27.9 |
27.9 (est.) |
27.0 |
27.5 |
27.0 |
|
Density (lb./in.3) |
0.285 |
0.285 |
0.288 |
0.284 |
0.289 |
0.289 |
0.292 |
|
Area Under Stress- Strain Curve |
4291 |
3976 |
4278 |
3763 |
2720 |
2462 |
2074 |
|
Fatigue Stress (ksi) at 107 Cycles (Runout) (R = -1, Kt = 1) |
137 |
137 |
150 |
143 |
110 |
128 |
112 |
|
Toughness Index |
103 |
89 |
69 |
43 |
67 |
57 |
36 |
|
Specific Strength (U.T.S./density) |
1007 |
1060 |
1094 |
1239 |
895 |
1007 |
1177 |
Longitudinal orientation
|
|
AerMet® Family |
Ti Alloys |
4340 Family |
|||||
|
Property |
900°F Aged 875°F Aged |
875°F Aged 875°F Aged |
Ti 10-2-3 |
|||||
|
Y.S. (ksi) |
246.0 |
258.0 |
275.0 |
314.0 |
174.5 |
162.0 |
225.0 |
243.0 |
|
U.T.S. (ksi) |
287.0 |
302.0 |
315.0 |
352.0 |
185.0 |
173.5 |
269.0 |
287.0 |
|
Elong. (%) |
16.1 |
14.2 |
14.5 |
11.3 |
8.5 |
12.5 |
12.0 |
9.8 |
|
R.A. (%) |
67.3 |
63.8 |
63.0 |
55.2 |
17.5 |
52.0 |
40.0 |
35.0 |
|
KIc (ksi in. 1/2) |
120.0 |
98.7 |
65.0 |
31.5 |
49.6 |
39.1 |
70.0 |
50.0 |
|
CVN I.E. (ft-lb.) |
35.0 |
30.0 |
20.0 |
10.8 |
22.0 |
18.5 |
18.0 |
18.0 |
|
Modulus (psi x 106) |
28.2 |
27.9 |
27.9 |
27.9 (est.) |
16.0 |
16.0 |
30.0 |
29.0 |
|
Density (lb./in.3) |
0.285 |
0.285 |
0.288 |
0.284 |
0.168 |
0.160 |
0.283 |
0.283 |
|
Area Under Stress- Strain Curve |
4291 |
3976 |
4278 |
3763 |
1528 |
2097 |
2964 |
2597 |
|
Fatigue Stress (ksi) at 107 Cycles (Runout) (R = -1, Kt = 1) |
137 |
137 |
150 |
143 |
120 |
102 |
79 |
85 |
|
Toughness Index |
103 |
89 |
69 |
43 |
46 |
45 |
61 |
52 |
|
Specific Strength (U.T.S./density) |
1007 |
1060 |
1094 |
1239 |
1101 |
1084 |
951 |
1014 |
Longitudinal orientation
The three toughness values for AerMet® 100 obviously vary considerably in magnitude. Compare the values mentioned for CVN impact energy and fracture toughness with the area under the stress-strain curve of 4291 (calculated as (16.1) x [246 + 287]/2). It is clear that simply multiplying these three values together, or arithmetically averaging the values to form a toughness index, would allow the area under the stress-strain curve to dominate.
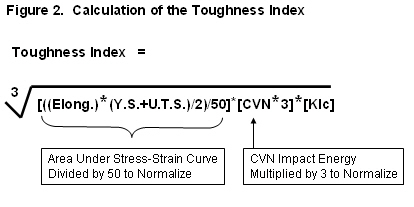
After examining the data for AerMet® 100, it appeared that the CVN impact energy and the area under the stress-strain curve could be normalized to be approximately the same as the fracture toughness by simple multiplication or division as shown by the following calculations:
CVN I.E. x 3 = ‘Normalized’ CVN = 35 x 3 = 105
Area Under the Stress-Strain Curve / 50 = ‘Normalized’ Area = 4291/50 = 85.8
Fracture Toughness = 120 ksi√in (no normalizing needed)
Note that the normalized measures are now of the same magnitude. They can be averaged to get an average toughness value. However, fracture toughness dominates the arithmetic average of the three normalized measures because it is the highest value in the range of the three numbers.
Taking the cube root of the product of the three normalized values would be calculating the geometric mean of the product. A geometric mean is defined as the nth root of a product of n terms:
Geometric Mean = n√ X1 x X2 x X3 x ….Xn
A geometric mean is often used to calculate averages for measures of geometric growth. The population growth of a town is an example of geometric growth. If the population grows significantly over a ten-year period from 250,000 to 500,000, the average population in year five can be calculated as the arithmetic average of 375,000. However, the geometric mean would be the square root of (250,000 x 500,000), or 353,553. This is a lower but more realistic number in this example.
The geometric mean of the three normalized toughness measures would help equalize weighting of each normalized toughness measure. Thus, the geometric mean would give a more realistic or conservative value for the overall toughness of an alloy. Consequently, it could act as a Toughness Index. In addition, the geometric mean satisfies the second criterion for an easy calculation with readily available data.
For AerMet® 100, the cube root of 105 x 85.8 x 120 results in a Toughness Index of 102.6. Since AerMet® 100 is a benchmark structural alloy for strength and toughness, almost all other alloys may be expected to have toughness indices less than 102.6. Thus, this method of calculation offers an additional advantage: the scale for the Toughness Index will be between zero and approximately 100. Figure 2 shows how to calculate the Toughness Index.
Alloy Evaluation
Table 1 contains typical mechanical properties for the AerMet® family, maraging alloys, titanium alloys, and the 4340 family of alloy steels. The bottom three rows in the table contain the data that could be used for the alloy selection process. Note the calculation of Specific Strength, which discounts density and allows steel and titanium to be compared.
Figures 3 and 4 summarize data from Table 1 into two graphs that may be useful for alloy selection. Figure 3, Toughness Index vs. Specific Strength, illustrates the dramatic advantage in toughness of the AerMet® family of alloys. Plotting the three data sources that comprise the Toughness Index separately would require three graphs instead of one and would provide similar results.
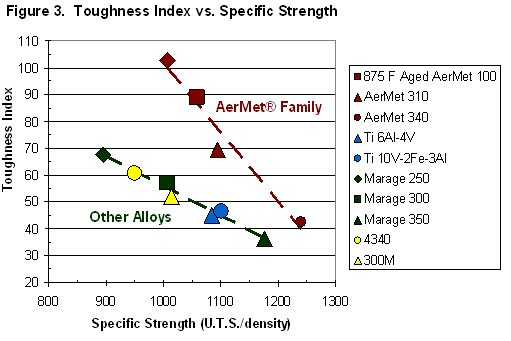
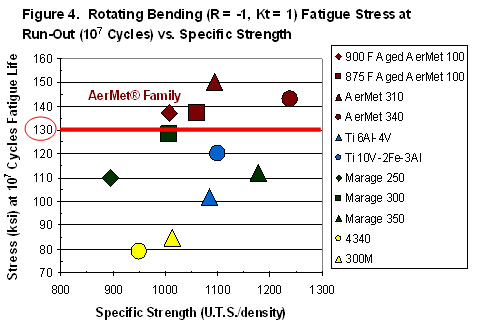
The Toughness Index and Specific Strength values allow the strength, toughness, and fatigue life of ten alloys to be compared with only two graphs. In fact, it may even be possible to compare these values in one three-dimensional graph. For example, the Goodman Diagram in Figure 1 might be modified to include the Toughness Index on a Z-axis. (However, that may end up being overly complicated.)
Index Drawbacks
So far, the Toughness Index has only two drawbacks. First, the initial calculation has been done with English units rather than metric units. Certainly, all the values can be converted to produce a Toughness Index in metric terms. That will be developed in tandem with a rising tide of international interest. Until then, the calculation can be accepted as an index without units. When the units go metric, the index could be plotted versus a Specific Strength calculated with metric units.
The second drawback of the Toughness Index is that it now works only for graphical comparisons. With their affinity for calculations, engineers might find the Toughness Index useful for correlating with other properties that do not correlate well with individual toughness measures such as ballistics.
During development of the Toughness Index, no attempt was made to rationalize the units. The Index would be difficult to use in calculations without rationalizing the units. This, too, could be done if interest warrants.
Your Perspective
This article is not intended to provide the perfect solution to toughness measurement. It is designed to help you calculate your own index based on numerical values for each of the three toughness measures in current practice. Units for the Index have not been determined here because they would overly complicate the basic issue of simplifying alloy comparison.
***
Paul M. Novotny, Carpenter Technology Corp.
Wyomissing, Pennsylvania